The 5% revenue drain: why utilities have outgrown the traditional dashboard
Energy and utility portfolios are losing up to 5% of annual revenue to invisible leaks — and after years of BI investment, it’s still slipping through. Here’s why traditional dashboards can’t close the gap.


Quick navigation
FAQs
According to recent industry benchmark data, energy and utility portfolios are losing up to 5% of annual revenue due to what analysts now call ‘invisible leaks’ –
- Unbilled consumption
- Missed price adjustments
- Billing errors too small to catch individually but too consistent to ignore.
After years of investment in business intelligence (BI) platforms, dashboards, and reporting tools, that 5% is still slipping through the cracks.
The inevitable question isn’t whether the problem exists. It’s why the tools we have aren’t solving it.
The dashboard was designed for a different era
BI dashboards were built to answer questions you already know to ask. They show you trends, flag variances, and summarize performance.
But in the era of high-frequency SAP IS-U environments with their integrated FI-CA sub-ledger and thousands of daily transactions, a dashboard, as a passive observer, is no longer relevant or sufficient for fast-paced, complex operations.
To illustrate, it can tell you that revenue is trending down. But it can’t tell you why an MRO was overridden manually last Tuesday, or whether a high-risk change to Installation Facts followed your internal dual-authorization protocol.
That gap between ‘revenue is down’ and ‘here’s exactly why’ is where the 5% of revenue drain lives.
And this is exactly the kind of answers that traditional BI dashboards can’t deliver.
The CFO’s call to action: active financial intelligence
Closing the revenue gap requires moving from a passive approach to active financial intelligence, which means two things:
Shifting from automation to agency.Processing transactions faster is no longer enough. The next tier of financial resilience comes from AI platforms that can reason through the full journey of a dollar – from a field-level meter reading to the general ledger – and identify the procedural shortcut or process deviation that passive tools overlook.
Evolving from sample coverage to maximum visibility. Traditional audit sampling was designed for a world where 5% was a reasonable proxy for 100%. That assumption no longer holds. Every unexamined transaction is a potential exposure – and a 95% blind spot is not a risk management strategy you can afford.
What a 7-Day proof of concept revealed
In a recent deployment of an AI-driven platform that can reason and provide 100% visibility, a leading national grid operator uncovered that the most significant finding wasn’t a single large fraud event – it was a systemic pattern.
A recurring set of procedural shortcuts in their check-rolling workflows had gone undetected because no single instance was large enough to flag.
By using an AI-driven platform that understands the financial logic of their specific SAP IS-U processes, not just the data patterns, the operator transformed finances, evolving from simply identifying a problem to fully understanding the root cause, and all this in less than 7 days.
The AI-driven platform didn’t just surface anomalies; it also identified them. It identified them, and it explained them.
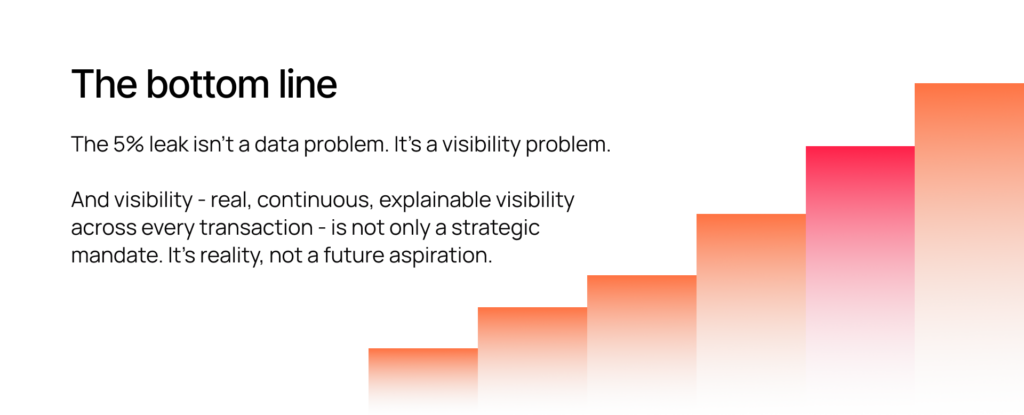
Ultimately, the utilities that close the revenue gap won’t be the ones with the most advanced dashboards. They’ll be the ones who stop asking their systems to report on the past and start asking them to protect the present.